Home Get Started Basic Usage Article
User Dashboard
Posted on 2025-01-15 Updated on 2025-01-15The Dashboard is typically the first screen you encounter upon logging in, and for good reason. It acts as a central hub, offering quick access to the key aspects of your current project. From here, you can easily navigate to important sections, monitor your quotas, and review your performance statistics.
This enables you to stay in control of your Brivo project and its impact on your business. Additionally, the Dashboard provides tailored recommendations for improvements and keeps you updated with the latest Brivo news and relevant articles.
The Dashboard - an overview
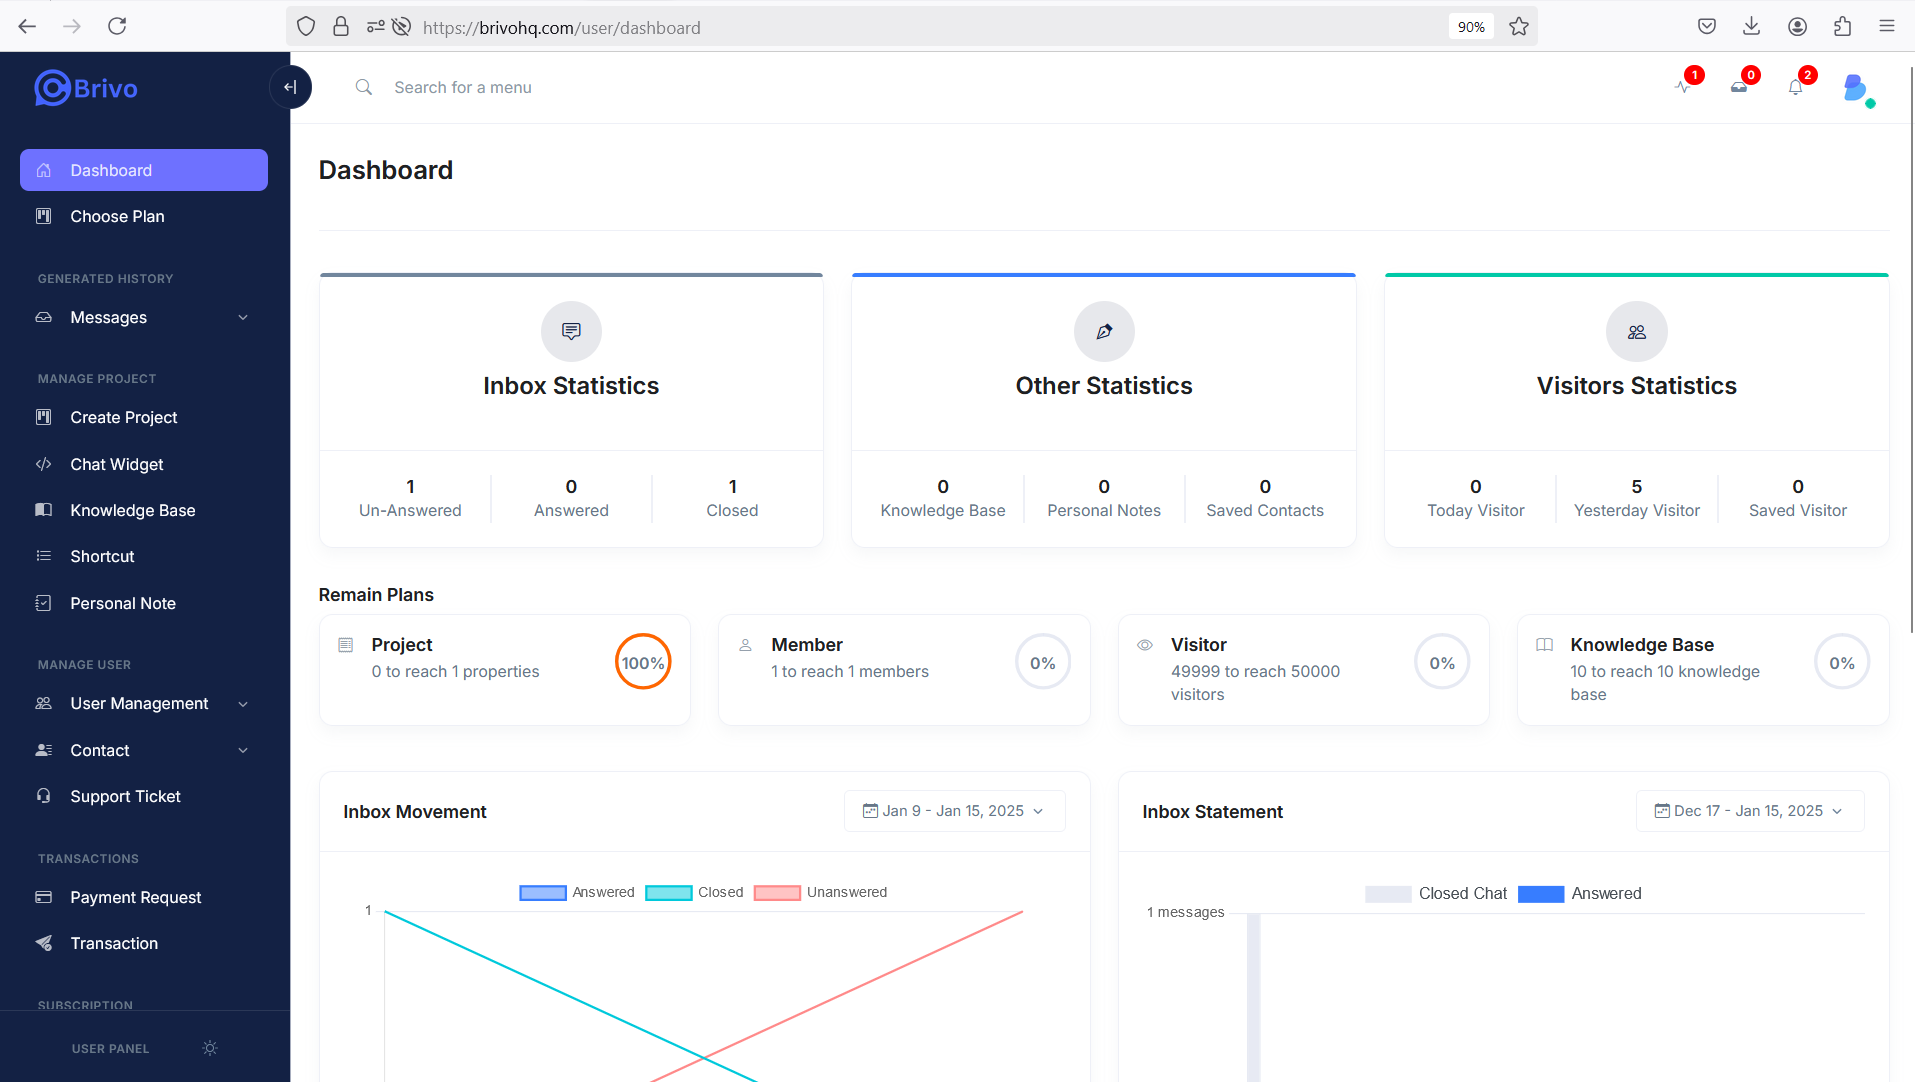
The Dashboard is designed to help you find everything you need in one place, featuring a clean and simple design. On the first screen, you'll find key information such as Inbox Statistics, Other Statistics, and Visitors Statistics, along with additional details as shown in the screen below.
Visitor Interactions
This graph displays all the interactions between your widget and visitors in your project so far:
- Live Conversations: The number of chats your operators have had
- Handled Tickets: The number of tickets your operators have responded to
- Flow Interactions: The number of times visitors have used your flows
- AI Chatbot Conversations: The number of questions answered
Found this article helpful?
[ 18 Out of 38 Found Helpful ]
